Introduction
What is Azure Databricks?
Azure Databricks is the same Apache Databricks, but a managed version by Azure. This managed service allows data scientists, developers, and analysts to create, analyse and visualize data science projects in cloud.
Databricks is a user friendly, analytics platform built on top of Apache Spark. Databricks acts as an UI layer, a WYSIWYG dashboard where you can create clusters, manage notebooks, write code and analyse data without knowing the internals of the system. Apache Spark is a unified analytics engine for large scale data processing and currently it supports popular languages such as Python, Scala, SQL and R.
About the article
If you know Apache Databricks already, then a tutorial is not necessary to get started because Azure Databricks also uses the same management portal used by Databricks.
Though there are different strategies possible to create and manage Databricks projects, I have followed below flow in this article:

Screenshots and steps provided in this article are valid as on 20 Sept 2018. Advancement in technology happening at a faster pace so as the Azure portal upgrades. So, please be aware of any portal flow changes when you try out the same. I will try to keep this tutorial up to date.
Login to Azure Portal
You must be having at least a trial account to get started. Visit Azure home page to get one – https://azure.microsoft.com/
Step 1: Create your first Databricks workspace
First step in creating a Databricks project is by creating a Workspace.
Typical steps will be to click “+ Create a resource” à “Analytics” à Azure Databricks

In the workspace creation wizard, you will have to provide below details:
A. Workspace name: Give a unique name (retry until you get a green tick mark at the right. You get a red X mark because someone already took your favourite names).
B. Subscription: Choose an appropriate subscription plan, or leave the default value if you do not know what this is about
C. Resource Group: Choose an existing resource group, or give a new one. (Provide a new name if you do not know what this box is about)
D. Location: This is the data center. Select your nearest location in the dropdown, or keep the default
E. Pricing Tier: Now this is about cost so be careful. I would prefer to go with a Free trial if I am doing this for learning purpose. You can read more about the pricing tiers here.

Click “Create” button and wait till the workspace get created. This will take couple of minutes and you will get the notification once it is completed.

Once he workspace is created, you can go to “All resources” and click your newly created workspace name in the list.

The resource dashboard will look like this:

Now it is time for some action. Click “Launch Workspace” button, and you will be directed to a new browser page. You will be signed into the portal automatically.
Your Azure Databricks journey starts here.
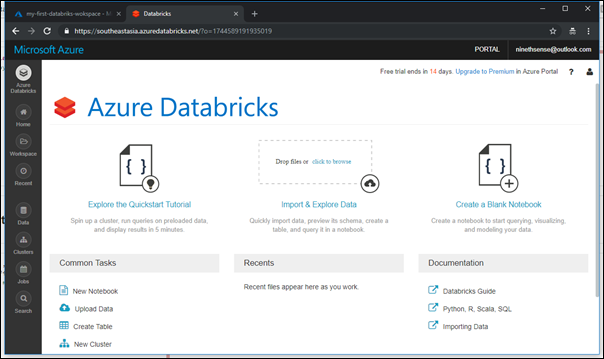
From here, there are different strategies possible to execute projects. Since a full-fledged project which includes a meaningful data analysis is out of scope of this article, we will try out a simple example like querying a dataset or plotting a bar chart.
Let us load a dataset and visualize using a notebook.
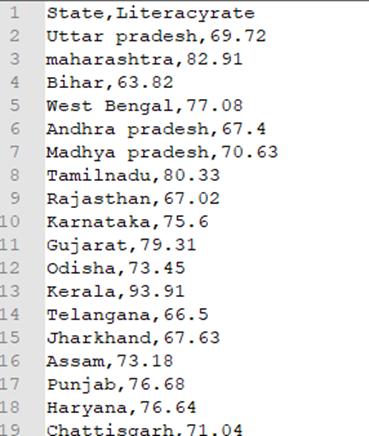
For the purpose, I have downloaded a dataset from internet, which is about the literacy rate in India. You may also download a freely available one, or create a dataset of your own. We are not going to do any complex analysis in this example so this simple dataset is enough. May note that the values in the dataset are not real values. My CSV file looks like this, with first row as header row.
Create Cluster
For storing the data and doing processing, we need some powerful machines. Let us call it clusters and create one in this section.
On the dashboard, click on “New Cluster”
I am giving the cluster a name “MyFirstCluster”. If you are good in Azure portal already then you know most of the input parameters mentioned in the page. Otherwise if you are a beginner, I suggest you to leave all the other settings ‘as it is’ and click “Create Cluster” button to proceed further.
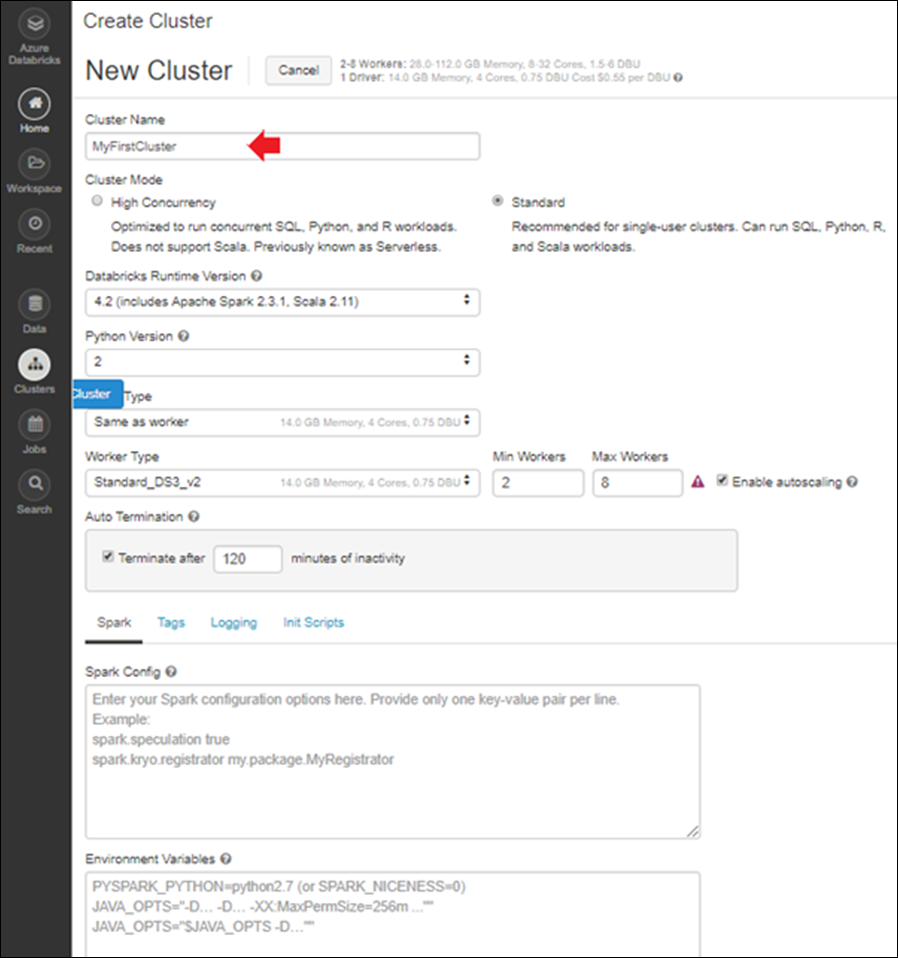
It will take some time to complete the cluster creation. For me it took about 5-10 minutes. You can see the status of cluster creation in next screen.

Once the cluster is created, the status will change from “Pending” to “Running”

Once the cluster is crated then we are read to upload data or creating notebooks. Let us upload the data first.
Upload data
Upload the already prepared/downloaded dataset to the newly created cluster.
Go back to the dashboard and click “Upload Data”

In the next screen, give the dataset a name and upload the dataset. In my case I am using a CSV file with some 35 rows. Your dataset can be a bigger one but note that depending on the size of the dataset the upload and processing can take more time.
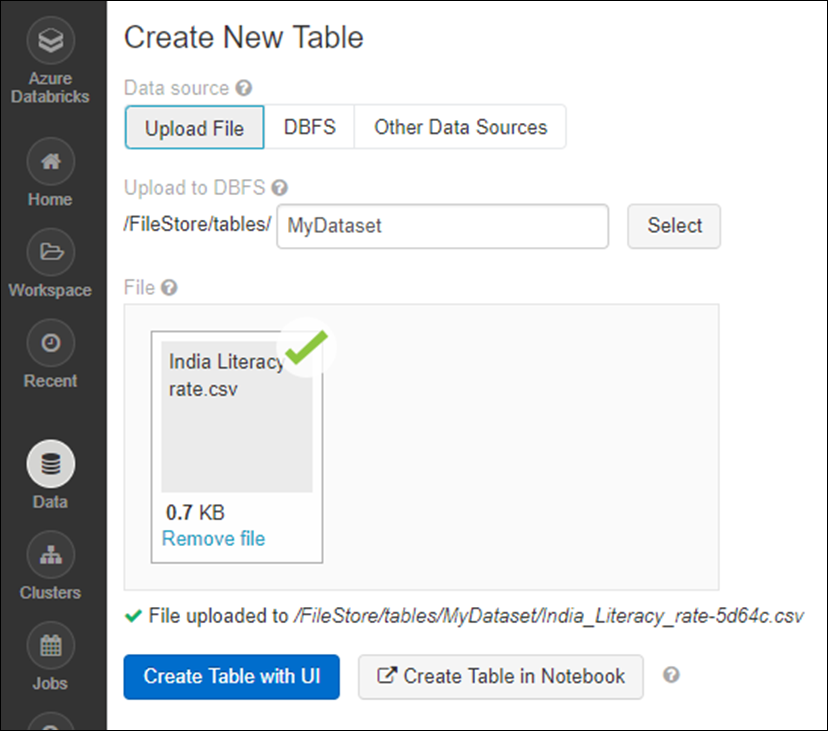
Once upload is completed, you can create the Notebook.
Create Notebook
A Notebook in the context is an interactive web based editor which allows data scientists, analysts and developers to write and collaborate scripts and notes to analyse and visualize.
You can either create the Notebook by clicking “Create Table” in the Dashboard screen, or as the continuation of the last step. When you click “Create Table in Notebook” button in the above screen, Databricks service will create sample notepad for you with sufficient sample code, with python as the default language.
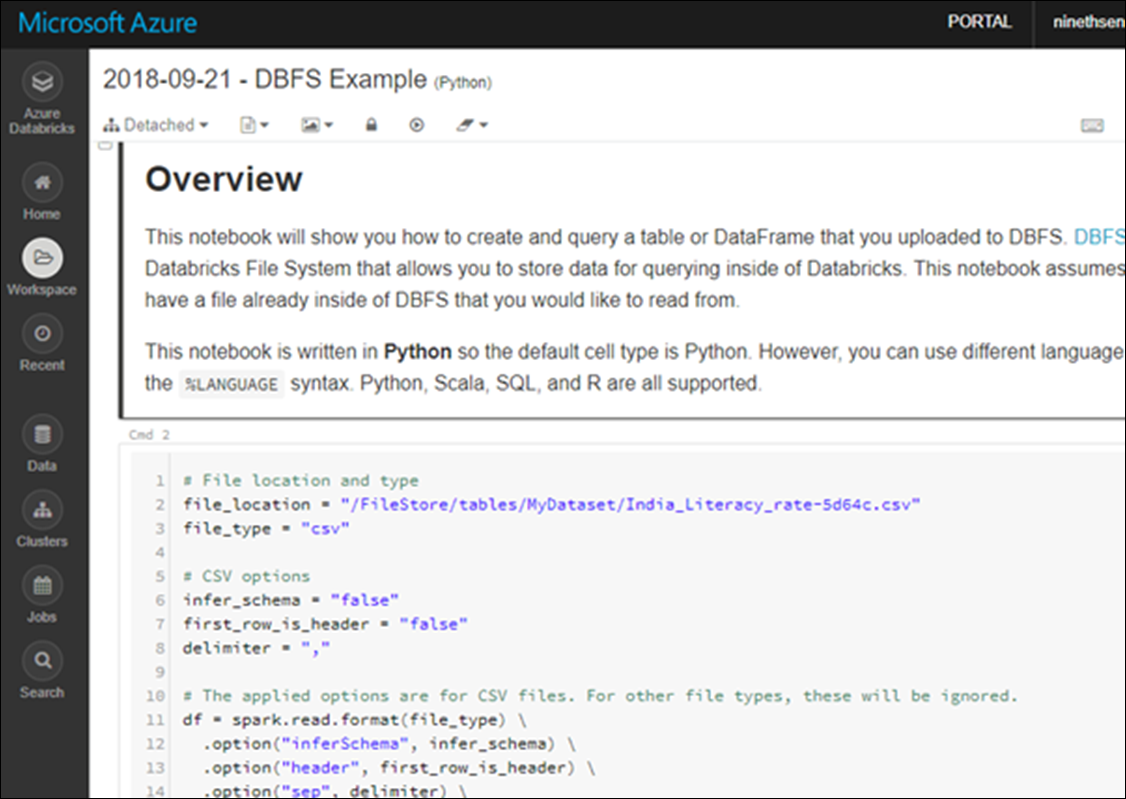
Make sure that you have the cluster attached to this notepad. If you see “Detached” status at left-top side, then make sure to choose a cluster by clicking on the “detached” text. Without a cluster, you cannot run the scripts.

Now it is time to test the script. You can see the sample python scripts in various script boxes in the page. You can click on the play button you see on right-top side of any script snippet box:

You should be able to see the script getting executed and result will be displayed below in the form of a table. If there are errors, you will be provided with proper error messages which you can use to debug the script.
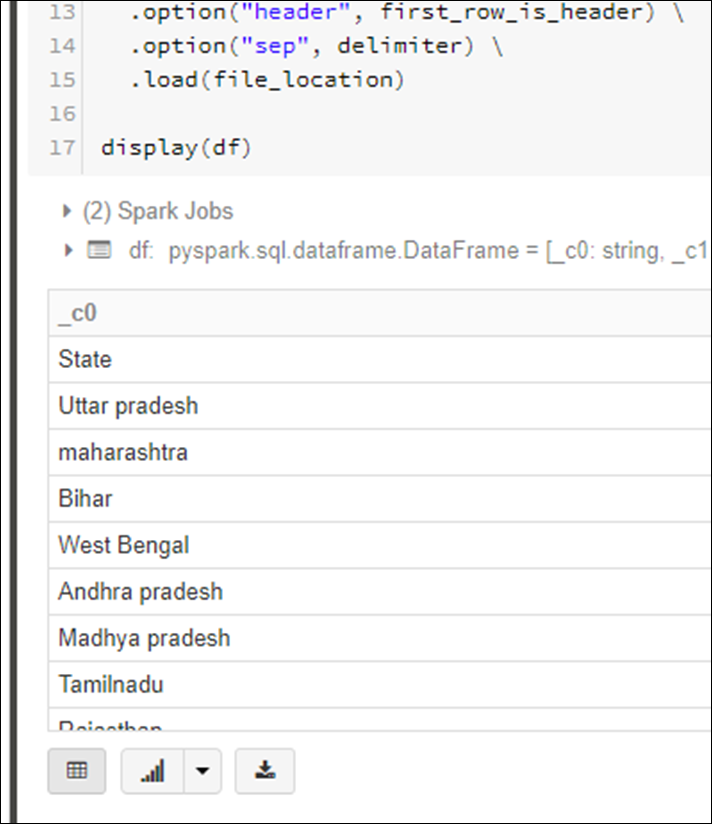
Now it is your time for experimenting and more learning.
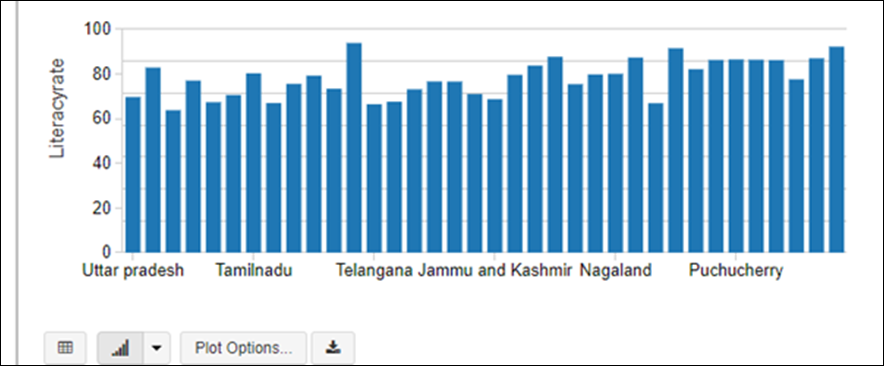
As a bonus, let us see how to visualize the same data using a bar chart. Click on the bar chart icon. If you do not see any charts auto generated, then click “Plot Options” and play around with the parameters.

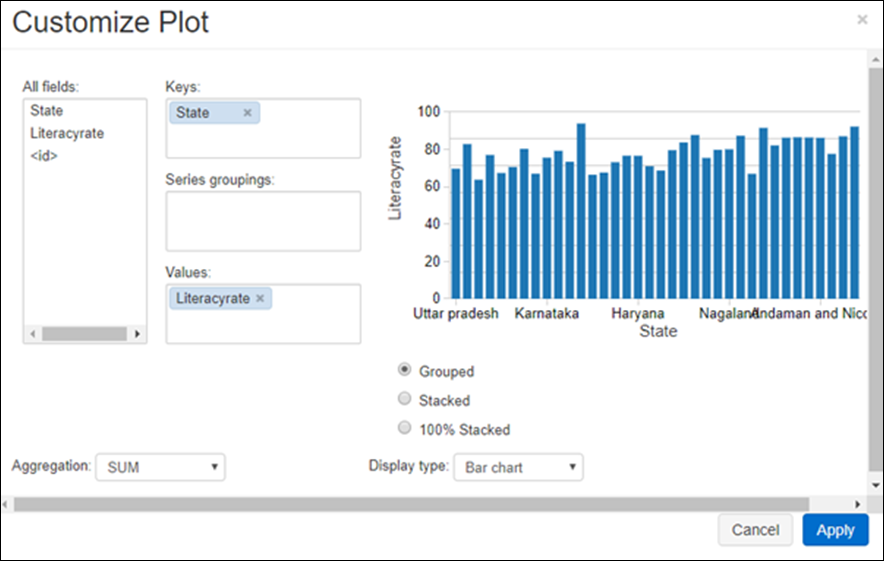
Click “Apply”, and now you can see the bar chart updated in the Notebook.
Happy Learning!
References:
- https://docs.microsoft.com/en-us/azure/azure-databricks/what-is-azure-databricks
- https://databricks.com/
- http://spark.apache.org/


